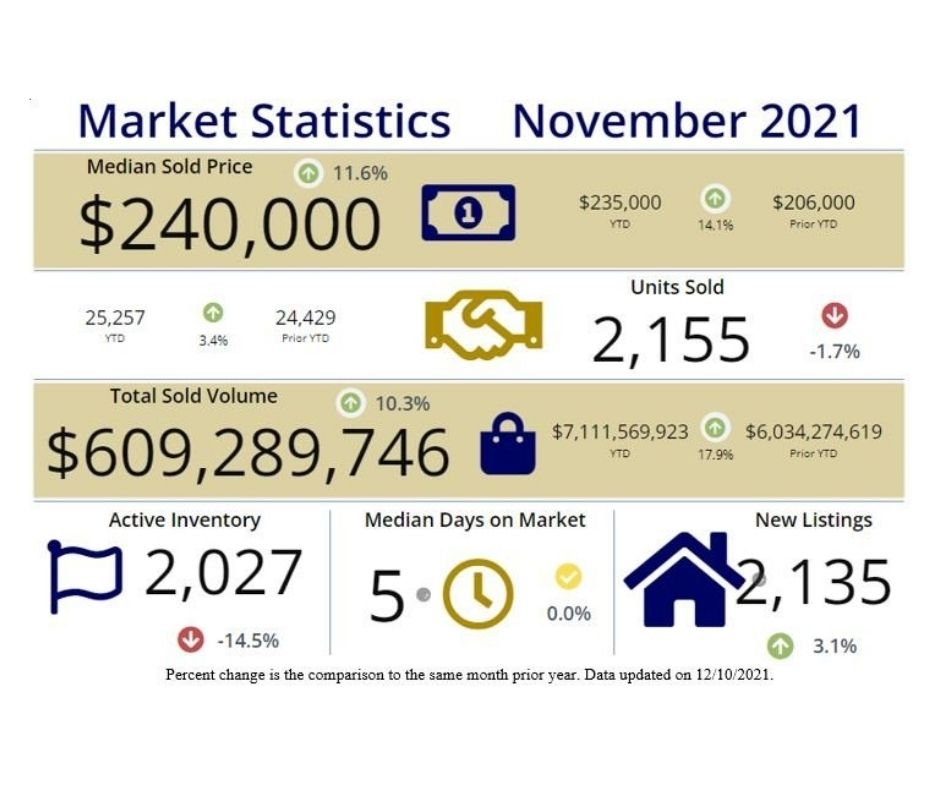
Mt. Lookout market—the REAL numbers 📈
Click the link for current stats you can trust. Mt. Lookout Market StatsAt Kopf Hunter & Haas, we guide with data, not emotions.📞 513.871.4040
Covering Hamilton, Butler, Clermont, & Warren Counties — Median Sold Price Units Sold More Inventory on the Market! The market is shifting — make your next move with confidence! Contact KHH to help you navigate today’s real estate trends.
The local real estate market remains active and competitive! Here’s what we’re seeing: Home Prices Are Rising Inventory Is Up Sellers Still Have the Edge While more homes are hitting the market, competition remains strong—many homes are still selling above asking price. Sellers: Enjoy increased demand and higher prices. Buyers: Take advantage of more inventory…
🏡 NAR’s 2025 Housing Market Forecast 📈 The National Association of Realtors (NAR) predicts:📉 Mortgage rates will average 6.4%🏠 Existing-home sales will rise 6%🏗️ New-home sales will improve 10%💰 National median home price will increase 3% What are your thoughts on the housing market next year? Let’s discuss! ⬇️ #RealEstate #HousingMarket #HomeBuying #KHH& #BUYINGSELLINGLOCAL
November 2021 – Market Report for Cincinnati Source: Cincinnati Board of Realtors November 2021 had the lowest affordability rate that the Cincinnati housing market has seen in the last five years. “Between the increased housing prices and the 6.5% inflation of prices of consumer goods seen in 2021, the affordability rate being low doesn’t come…
Cincinnati Market Report for September 2021 Source: Cincinnati Area Board of REALTORS The Cincinnati housing market continues to sustain a strong demand with low inventory numbers and high sales prices, but are we beginning to see a shift? “While the numbers are higher than in past years, the data trends are beginning to fall in…
August 2021 – Cincinnati Sees Price Adjustments Source: Cincinnati Area Board of Realtors (CABR) While the Cincinnati housing market continues to be marked by strong sales prices, August marked the largest average price change of homes on the market since before 2019. In July, the average price change was a decrease of 4.4%, which matched…
July 2021 – Is it the Beginning of a Market Change? Source: Cincinnati Area Board of Realtors July showed an interesting shift in the market. Compared to June 2021, the total sold volume is down $152,614,612 a decrease of 19.5%. While the Median Sold price is up 12.5% from July 2020, it is down 2.6%…